| ||
|
By Steve Graham, Claire Parkinson, and Mous Chahine Introduction
Water, Water, Everywhere One estimate of global water distribution:
Estimates of groundwater are particularly difficult and vary widely amongst sources, with the value in this table being near the high end of the range. Using the values in this table, groundwater constitutes approximately 30% of fresh water, whereas ice (including ice caps, glaciers, permanent snow, ground ice, and permafrost) constitute approximately 70% of fresh water. With other estimates, groundwater is sometimes listed as 22% and ice as 78% of fresh water. |
||||||||||||||||||||||||||||||||||||||||||||||||||||||||||||||||||||
|
A Multi-Phased Journey
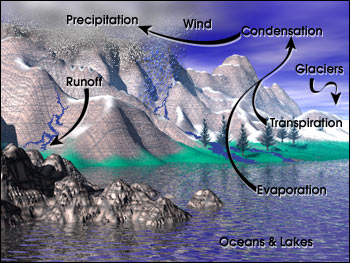
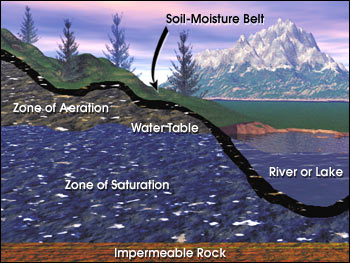
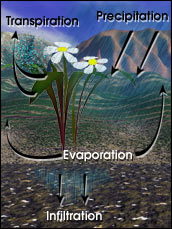
Studies have revealed that the oceans, seas, and other bodies of water (lakes, rivers, streams) provide nearly 90% of the moisture in our atmosphere. Liquid water leaves these sources as a result of evaporation, the process by which water changes from a liquid to a gas. In addition, a very small portion of water vapor enters the atmosphere through sublimation, the process by which water changes from a solid (ice or snow) to a gas. (The gradual shrinking of snow banks, even though the temperature remains below the freezing point, results from sublimation.) The remaining 10% of the moisture found in the atmosphere is released by plants through transpiration. Plants take in water through their root systems to deliver nutrients to their leaves, then release it through small pores, called stomates, found on the undersides of their leaves. Together, evaporation, sublimation, and transpiration, plus volcanic emissions, account for all the water vapor in the atmosphere. While evaporation from the oceans is the primary vehicle for driving the surface-to-atmosphere portion of the hydrologic cycle, transpiration is also significant. For example, a cornfield 1 acre in size can transpire as much as 4000 gallons of water every day. After the water enters the lower atmosphere, rising air currents carry it upward, often high into the atmosphere, where the air cools and loses its capacity to support water vapor. As a result, the excess water vapor condenses (i.e., changes from a gas to a liquid) to form cloud droplets, which can eventually grow and produce precipitation (including rain, snow, sleet, freezing rain, and hail), the primary mechanism for transporting water from the atmosphere back to the Earth's surface. When precipitation falls over the land surface, it follows various routes. Some of it evaporates, returning to the atmosphere, and some seeps into the ground (as soil moisture or groundwater). Groundwater is found in two layers of the soil, the "zone of aeration," where gaps in the soil are filled with both air and water, and, further down, the "zone of saturation," where the gaps are completely filled with water. The boundary between the two zones is known as the water table, which rises or falls as the amount of groundwater increases or decreases. The rest of the water runs off into rivers and streams, and almost all of this water eventually flows into the oceans or other bodies of water, where the cycle begins anew (or, more accurately, continues). At different stages of the cycle, some of the water is intercepted by humans or other life forms.
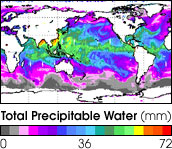
Even though the amount of water in the atmosphere is only 12,900 cubic kilometers (a minute fraction of Earth's total water supply that, if completely rained out, would cover the Earth's surface to a depth of only 2.5 centimeters), some 495,000 cubic kilometers of water are cycled through the atmosphere every year, enough to uniformly cover the Earth's surface to a depth of 97 centimeters. Because water continually evaporates, condenses, and precipitates, with evaporation on a global basis approximately equaling global precipitation, the total amount of water vapor in the atmosphere remains approximately the same over time. However, over the continents, precipitation routinely exceeds evaporation, and conversely, over the oceans, evaporation exceeds precipitation. In the case of the oceans, the routine excess of evaporation over precipitation would eventually leave the oceans empty if they were not being replenished by additional means. Not only are they being replenished, largely through runoff from the land areas, but, over the past 100 years, they have been over-replenished, with sea level around the globe rising by a small amount. Sea level rises both because of warming of the oceans, causing water expansion and thereby a volume increase, and because of a greater mass of water entering the ocean than the amount leaving it through evaporation or other means. A primary cause for increased mass of water entering the ocean is the calving or melting of land ice (ice sheets and glaciers).
Throughout the hydrologic cycle, there are an endless number of paths that a water molecule might follow. Water at the bottom of Lake Superior may eventually fall as rain in Massachusetts. Runoff from the Massachusetts rain may drain into the Atlantic Ocean and circulate northeastward toward Iceland, destined to become part of a floe of sea ice, or, after evaporation to the atmosphere and precipitation as snow, part of a glacier. Water molecules can take an immense variety of routes and branching trails that lead them again and again through the three phases of ice, liquid water, and water vapor. For instance, the water molecules that once fell 100 years ago as rain on your great grandparents' farmhouse in Iowa might now be falling as snow on your driveway in California. |
|
The Water Cycle and Climate Change
|
|
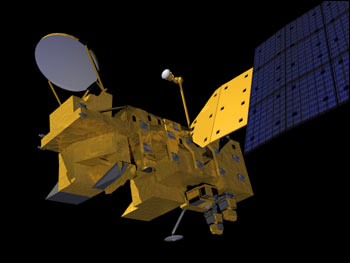
The Aqua Mission and the Water Cycle
Aqua's contributions to monitoring water in the Earth's environment will involve all six of Aqua's instruments: the Atmospheric Infrared Sounder (AIRS), the Advanced Microwave Sounding Unit (AMSU), the Humidity Sounder for Brazil (HSB), the Advanced Microwave Scanning Radiometer-Earth Observing System (AMSR-E), the Moderate Resolution Imaging Spectroradiometer (MODIS), and Clouds and the Earth's Radiant Energy System (CERES). The AIRS/AMSU/HSB combination will provide more-accurate space-based measurements of atmospheric temperature and water vapor than have ever been obtained before, with the highest vertical resolution to date as well. Since water vapor is the Earth's primary greenhouse gas and contributes significantly to uncertainties in projections of future global warming, it is critical to understand how it varies in the Earth system. The water in clouds will be examined with MODIS, CERES, and AIRS data; and global precipitation will be monitored with AMSR-E. The cloud data will include the height and areal coverages of clouds, the liquid water content, and the sizes of cloud droplets and ice particles, the latter sizes being important to the understanding of the optical properties of clouds and their contribution to the Earth's albedo (reflectivity). HSB and AMSR-E, both making measurements at microwave wavelengths, will have the ability to see through clouds and detect the rainfall under them, furthering the understanding of how water is cycled through the atmosphere. Frozen water in the oceans, in the form of sea ice, will be examined with both AMSR-E and MODIS data, the former allowing routine monitoring of sea ice at a coarse resolution and the latter providing greater spatial resolution but only under cloud-free conditions. Sea ice can insulate the underlying liquid water against heat loss to the often frigid overlying polar atmosphere and also reflects sunlight that would otherwise be available to warm the ocean. AMSR-E measurements will allow the routine derivation of sea ice concentrations in both polar regions, through taking advantage of the marked contrast in microwave emissions of sea ice and liquid water. This will continue, with improved resolution and accuracy, a 22-year satellite record of changes in the extent of polar ice. MODIS, with its finer resolution, will permit the identification of individual ice floes, when unobscured by clouds. AMSR-E and MODIS will also provide monitoring of snow coverage over land, another key indicator of climate change. Here too, the AMSR-E will allow routine monitoring of the snow, irrespective of cloud cover, but at a coarse spatial resolution, while MODIS will obtain data with much greater spatial detail under cloud-free conditions. As for liquid water on land, AMSR-E will provide an indication of soil moisture, which is crucial for the maintenance of land vegetation, including agricultural crops. AMSR-E's monitoring of soil moisture globally should permit, for example, the early identification of signs of drought episodes. |
|
The Aqua Spacecraft
The Aqua spacecraft will circle the Earth in an orbit that ascends across the equator each day at 1:30 p.m. local time and passes very close to the poles, complementing the 10:30 a.m. measurements being made by Terra, the first of the EOS spacecraft, launched in December 1999. The instrument complement on Aqua is designed to provide information on a great many processes and components of the Earth system, including cloud formation, precipitation, water vapor, air temperature, cloud radiative properties, sea surface temperature, surface wind speeds, sea ice concentration and temperature, snow cover, soil moisture, and land and ocean vegetation. The individual swaths of measurements will be compiled into global images, with global coverage of many variables being obtained as frequently as every two days or, with the help of numerical models, combined every 6 or 12 hours into comprehensive representations of the Earth's atmospheric circulation and surface properties. In combination with measurements from other polar orbiting satellites, Aqua measurements will also provide accurate monthly-mean climate assessments that can be compared with and assimilated into computer model simulations of the Earth's climate. The Earth Observing System has three major components: the EOS spacecraft, an advanced ground-based computer network for processing, storing, and distributing the collected data (the EOS Data and Information System); and teams of scientists and applications specialists who will study the data and help users in universities, industry, and the public apply it to issues ranging from weather forecasting and climate prediction to agriculture and urban planning. |
|
Print References |