|
||
|
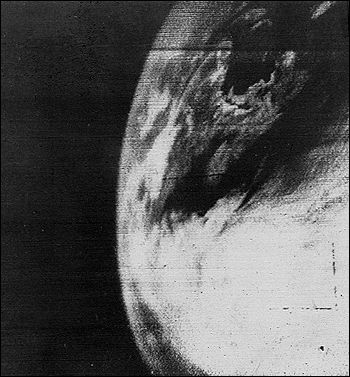
By Michael King and David Herring Reprinted here with permission of the Encyclopedia of Atmospheric Sciences, Edited by Jim Holton, John Pyle, and Judy Curry; published by Academic Press 2002. The atmosphere changes chemically and physically on widely varying time scales—ranging from minutes to decades—and is therefore a challenge to measure precisely over the entire globe. But with the National Aeronautics and Space Administration’s (NASA) 1960 launch of the Television Infrared Observation Satellite (TIROS), Earth scientists began a new mission to observe large-scale weather patterns from space. In the late 1970s, their mission expanded to include global-scale measurements that would help them understand the causes and effects of longer-term climate change. NASA and its affiliated agencies and research institutions collaborated to develop a series of research satellites that have enabled scientists to test new remote sensing technologies that have advanced scientific understanding of both chemical and physical changes in the atmosphere. (“Remote sensing” involves the use of devices other than our eyes to observe or measure things from a distance without disturbing the intervening medium.) The goal is to examine our world comprehensively to determine what dynamics drive our planet’s climate system and how climate change affects, and is affected by, our environment.
Depending upon their measurement objectives, research satellites primarily fly in one of two orbits: (1) a near-polar, sun-synchronous orbit to allow their senors to observe the entire globe at the same solar time each day, or (2) a mid-inclination, precessing orbit to focus their sensors on the equator and lower latitudes where the observations are made at different times of day to better sample time-varying phenomena such as clouds. Some polar-orbiting satellite sensors can observe any given place on the globe as often as every day, thus collecting data with high temporal (time) resolution. Other satellite sensors view any given place as infrequently as once every 16 days, thus having relatively low temporal resolution for a satellite sensor, but still far surpassing our ability to make these same measurements with surface-based or aircraft sensors. Satellite sensors with high spatial resolution (15 meters per pixel) can discern objects in the atmosphere or on the surface as small as say a football field or farmland, thus providing high spatial resolution. Other satellite sensors that are designed to measure continental and global-scale dynamics typically have only moderate (500 meters per pixel) to low (20 kilometers per pixel) spatial resolution. Satellite sensors carry specially designed detectors that are particularly sensitive to certain wavelengths of the electromagnetic spectrum, called spectral bands. The more precisely a remote sensor can measure narrow bands of radiant energy, and the greater the number of these discreet bands it can measure, the higher is its spectral resolution. The atmosphere interacts with solar radiation much like a venetian blind—selectively absorbing and reflecting certain wavelengths of solar energy while allowing others to pass through. Engineers design satellite remote sensors to be particularly sensitive to those wavelengths that can be reflected or emitted back up through the atmosphere to space, thus enabling them to make their measurements. |
|
|
|
Earth-orbiting remote sensors provide the best means of collecting the data scientists need because they can measure things on scales of time and space that otherwise would not be possible. Moreover, satellite sensors not only observe wavelengths of visible light, they also precisely measure wavelengths of radiant energy that our eyes cannot see, such as microwaves, ultraviolet rays, or infrared light. If scientists know how certain objects (like cirrus clouds or windblown dust) typically absorb, reflect, and emit particular wavelengths of radiant energy, then by using satellite sensors to precisely measure those specific bands of the electromagnetic spectrum, scientists can learn a lot about the Earth’s atmosphere and surface. Remote sensors allow us to observe and quantify key climate and environmental vital signs such as temperature, ozone concentrations, carbon monoxide and other pollutants, water vapor and other greenhouse gases, cloud types and total cloud cover, aerosol types and concentrations, radiant energy fluxes, and many more.
|
|
Balancing Earth’s Radiant Energy Budget
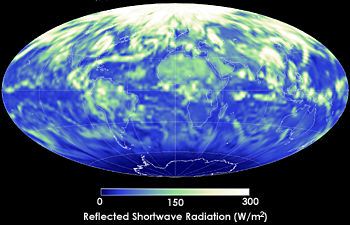
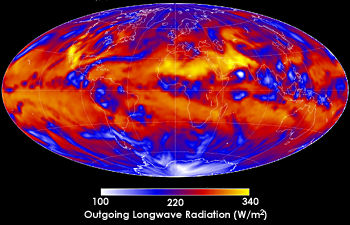
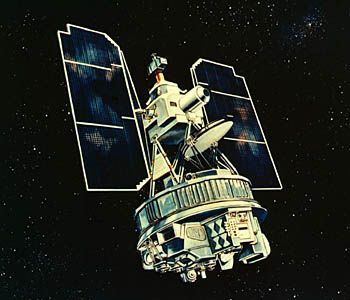
In 1978, NASA launched its Nimbus-7 satellite carrying a new sensor, called the Earth Radiation Budget (ERB) experiment, designed to measure direct solar irradiance, reflected shortwave radiation (visible light), and emitted longwave radiation (heat) every day over the entire Earth. This was the first space-based sensor capable of self-calibrating so that its total solar irradiance measurements were accurate to within ± 0.5 percent. The Nimbus-7 ERB collected nine years of global-scale data upon which scientists began long-term climate studies. In the interest of extending the ERB data set and improving upon its measurement capabilities, NASA launched three more Earth Radiation Budget Experiments (renamed ERBE) in the 1980s.
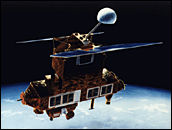
The Earth Radiation Budget Satellite (ERBS) was deployed from the Space Shuttle Challenger in October 1984 by NASA Astronaut Sally Ride. ERBS was the first of three spacecraft to carry copies of the Earth Radiation Budget Experiment (ERBE) sensor, which have provided scientists with measurements of the Earth’s radiant energy budget for almost two decades. (Image courtesy NASA GSFC) In addition to total solar irradiance, ERBE measured the reflected solar and emitted thermal radiation from the Earth-atmosphere-ocean system. These observations revealed that over the course of a year the global radiation budget is in balance—the Earth reflects and emits roughly the same amount of energy back into space that it receives from the sun. The data also showed that the average annual, global contribution by clouds is they reflect 17 Wm-2 more shortwave energy (visible light) than they trap as longwave energy (heat). Yet, due to calibration uncertainties, deficiencies in ERBE’s sampling method, and the limitations of existing angular dependence models there still exists a significant uncertainty (about ± 5 Wm Wm-2) regarding our understanding of Earth’s radiation budget. Part of this uncertainty lies in our limited knowledge of the spatial distribution of clouds as well as the optical properties of these clouds over time. Moreover, we cannot be sure how the distribution and optical properties of clouds will change over time. The endeavor to address these issues began with the 1997 launch of the Clouds and the Earth’s Radiant Energy System (CERES) sensor aboard the joint NASA/NASDA Tropical Rainfall Measuring Mission (TRMM) satellite. Twin CERES instruments were also launched aboard NASA’s Terra satellite in December 1999, and the pair will again fly aboard NASA’s Aqua satellite launched in early 2002. Many of the sampling and accuracy limitations on ERBE were addressed in the design of CERES so that it allows scientists to meet ERBE’s same measurement objectives with better than twice the former sensor’s accuracy. Ultimately, scientists anticipate that CERES will not only extend the ERBE data set, but it will provide the first long-term global measurements of the radiative fluxes within the Earth’s atmosphere that will help us more accurately account for the effects of aerosols and clouds on climate. |
|
Dust in the Wind
Through the 1980s and most of the 1990s the NOAA AVHRR was the most frequently used satellite sensor for measuring aerosol optical thickness. (Aerosol optical thickness is a measure of how much sunlight airborne particles prevent from traveling through a column of atmosphere.) However, AVHRR can only make such measurements over the ocean, as the sensor requires a relatively uniform and dark-colored background. Because TOMS is particularly sensitive to absorbing aerosols, over both land and ocean, this sensor has also been widely used to measure aerosol optical thickness. In April 1991, the European Space Agency launched a new type of multi-angle sensor, called the Along Track Scanning Radiometer (ATSR), aboard their first European Remote Sensing Satellite (ERS-1). The ATSR makes aerosol optical thickness measurements by remotely sensing visible and near-infrared wavelengths at nadir and oblique forward scan angles (both within a two-minute interval). A modified version of the sensor, called the Advanced Along Track Scanning Radiometer (AATSR), was launched in 1995 aboard ERS-2. While data from neither of these missions have yet been used to produce global-scale aerosol measurements, this should be possible. In 1996, Japan launched the first in their series of Advanced Earth Observation Satellites (ADEOS) satellites, which carried a payload of two sensors—the Polarization and Directionality of the Earth’s Reflectances (POLDER) sensor, contributed by the French Space Agency, and the Ocean Color and Temperature Scanner (OCTS), provided by NASDA. Both sensors can retrieve aerosol measurements, but POLDER was the first satellite sensor specifically designed to measure aerosols and it can make its measurements over both land and ocean. The sensor observes Earth targets from 12 directions that enable measurements of the bidirectionality and polarization of solar radiation reflected from within the atmosphere. Unfortunately, due to its solar panel failing, the ADEOS mission ended prematurely after only eight months in orbit.
Three sensors aboard NASA’s Terra satellite are particularly well suited for studying the effects of aerosols on climate: CERES, MISR, and MODIS. The Global Imager (GLI) planned for launch aboard ADEOS II offers aerosol measurement capabilities similar to those of MODIS. Both these sensors have the capacity to measure both aerosol optical thickness as well as the sizes of aerosol particles over both ocean and land. Particle size is an indicator of the source of the aerosol particles and helps scientists distinguish aerosols of natural origin from those that are man-made. Moreover, with its nine different look angles, MISR is ideally designed to quantify the reflective properties. Again, CERES complements MODIS and MISR by providing measurements of the shortwave radiation that aerosols reflect back into space. Together, these sensors are providing new insights into the roles of clouds and aerosols in Earth’s total energy budget. |
|
Abstract Art or Arbiters of Energy?
Two new sensors flying aboard NASA’s Terra satellite, launched in December 1999, are designed to help scientists answer these questions. The Moderate-resolution Imaging Spectroradiometer (MODIS) and the Multi-angle Imaging Spectroradiometer (MISR) give scientists new capabilities for measuring the structure and composition of clouds. MODIS observes the entire Earth almost every day in 36 spectral bands ranging from visible to thermal infrared wave-lengths. With spectral and spatial resolutions superior to that of AVHRR (its heritage sensor), MODIS can measure a wide suite of clouds' physical and radiative properties. Specifically, MODIS can determine whether a cloud is composed of ice or water particles (or some combination of the two), it can measure the effective radius of the particles within a cloud, it can observe how much (or little) sunlight passes through a cloud, and it can measure the temperature and altitude of cloud tops. Moreover, with its unique 1.37-micron channel, MODIS observes thin cirrus clouds with unprecedented sensitivity. This channel not only enables scientists to quantify the impact of cirrus clouds on the radiation balance, but it also permits image analysts to “correct” for the presence of cirrus in remote-sensing scenes used to examine surface or lower-level features.
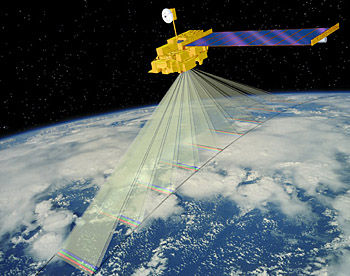
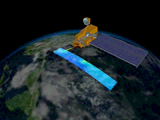
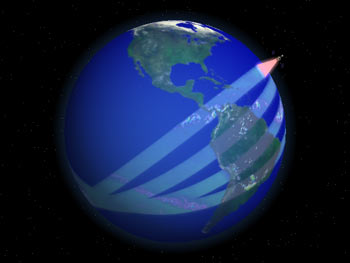
The MODIS instrument, aboard NASA’s Terra satellite, is sensitive to 36 different wavelengths ranging from the visible to the thermal infrared region of the spectrum. With its 2,330-km-wide swath, MODIS “sees” the entire Earth almost every day, making it an ideal sensor for observing and measuring global-scale dynamics. (Animation courtesy Reto Stockli) Click here for an animation (will open in a new window). Complementing MODIS, the MISR instrument “sees” the Earth simultaneously in red, green, blue, and near infrared wavelengths at nine different angles—at four progressively more oblique angles ahead of Terra, four angles aft of the satellite, and one at nadir. Because it measures any given scene from multiple angles, MISR is ideally designed to help scientists better understand how clouds interact with radiant energy as both a function of their structure and type. CERES complements MODIS and MISR by providing measurements of the shortwave and longwave radiant energy that clouds reflect and emit back into space. ESA’s next-generation satellite missions for comprehensively examining Earth’s climate system will begin with the late 2002 launch of its first Environmental Satellite (Envisat). Similar to MODIS in the scope of its research applications, Envisat carries the Medium-Resolution Imaging Spectrometer (MERIS). Like Terra’s MODIS, MERIS has a wide viewing swath (1,500 km), with a morning equatorial crossing, and it can see the entire Earth within every 3 days. Scientists are using its data to derive cloud cover, cloud altitude, water vapor, and aerosol properties. Unlike MODIS (which uses a cross-track scan mirror), MERIS is a push-broom scanner based upon Charge-Coupled Device (CCD) technologies with gains and offset settings that can be optimized for observing specific targets. This is a similar technology to that used by MISR. |
|
Serendipity and Stratospheric Ozone
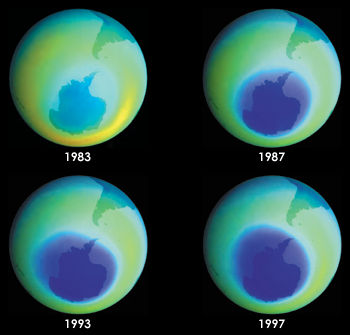
So, in addition to ERB, in 1978 Nimbus-7 carried two other new NASA sensors designed to measure the total amount of ozone in a given column of atmosphere over the entire globe—called the Solar Backscatter Ultraviolet (SBUV) instrument and the Total Ozone Mapping Spectrometer (TOMS). Sensitive to radiant energy in the ultraviolet region of the spectrum, these sensors took advantage of the fact that molecules and aerosol particles reflect certain wavelengths of ultraviolet rays while ozone absorbs others at different levels in the atmosphere. By analyzing the amount of ultraviolet energy reflected back up to the spacecraft, researchers could produce profiles of how thick or thin the ozone was at different altitudes and locations. Ironically, it wasn't until October 1985 that a British team of scientists found a significant reduction in ozone over Halley Bay, Antarctica. Using a ground-based Dobson ozone spectrophotometer, the team found that the amount of stratospheric ozone over Halley Bay was about 40 percent less than it had been the previous year. Their finding stunned the science community because they were expecting anthropogenic ozone depletion to occur first at upper levels in the stratosphere (30 to 50 km) and so they anticipated that the initial signal of depletion in a total column of ozone would be weak. NASA researchers hastily reviewed their TOMS data and found that it too had detected a dramatic loss of ozone over all of Antarctica. Why hadn't they discovered the phenomenon earlier? Unfortunately, the TOMS data analysis software had been programmed to flag and set aside data points that deviated greatly from expected measurements and so the initial measurements that should have set off alarms were simply overlooked. In short, the TOMS team failed to detect the ozone depletion years earlier because it was much more severe than scientists expected.
In the years following the discovery of the ozone hole, NASA and ESA satellites recorded depleting ozone levels over Antarctica growing worse with each passing year. In response, in 1987, 43 nations signed the “Montreal Protocol” in which they agreed to reduce the use of CFCs by 50 percent by the year 2000. This protocol was amended in 1990 to eliminate all CFC emissions by 2000. ESA’s second European Remote-Sensing Satellite (ERS-2) carries a new sensor called the Global Ozone Monitoring Experiment (GOME). GOME is a nadir-looking sensor with four bands ranging from 240 to 790 nm for measuring backscattered visible and ultraviolet solar radiation. Since the summer of 1996, ESA has routinely produced 3-day global measurements of total ozone and nitrogen dioxide using GOME data. As recently as 1998, both TOMS and GOME data show that at its Austral spring low, Antarctic ozone concentrations had worsened to 80 percent less than early 1970s levels. Today there is some evidence that levels of chlorine in the stratosphere are leveling off. Is this a scientific success story in the making? Will stratospheric ozone concentrations return to pre-1970s levels as the abundance of stratospheric chlorine stabilizes? Only time and continued monitoring will tell. ESA launched its Environmental Satellite (Envisat) in November 2001 with a new sensor called Global Ozone Monitoring by Occultation of Stars (GOMOS). |
|
The Chemistry of Earth’s Atmosphere In 1991, NASA launched the Upper Atmosphere Research Satellite (UARS) with a payload of 10 sensors for measuring a wide array of chemical and physical phenomena in the stratosphere and mesosphere (the layer of atmosphere from approximately 10 to 90 km in altitude). Not only did UARS extend scientists' ability to monitor stratospheric ozone concentrations into the 1990s, but it also provided the first comprehensive picture of the photochemical processes involved in ozone destruction. The UARS Microwave Limb Sounder (MLS) demonstrated that there is a direct link between the presence of chlorine, the formation of chlorine monoxide during winter in the Southern Hemisphere, and the destruction of ozone.
UARS carries the first two spaceborne remote wind sounders ever launched, called the High Resolution Doppler Imager (HRDI) and Wind Imaging Interferometer (WINDII). These sensors measured winds in the mesosphere through detection of shifts in airglow emission lines. Additionally, HRDI can also detect daytime stratospheric winds by observing Doppler shifts in oxygen absorption lines. WINDII and HRDI gave scientists the first complete global picture of mesospheric circulation. Together with the Halogen Occultation Experiment (HALOE) and MLS aboard UARS, the sensors enabled scientists to track the upward transport of water vapor in the tropical stratosphere. Data from these sensors showed that the tropical tropopause (the gateway from the troposphere to the stratosphere) air rises into the stratosphere through towering thunderheads along the Intertropical Convergence Zone (ITCZ) running roughly parallel to the equator. Once in the stratosphere, this air moves slowly upward and outward toward the mid-latitudes. Ozone begins to form as incoming ultraviolet radiation breaks oxygen molecules (O2) into free oxygen atoms (O) that quickly bond with other oxygen molecules to form ozone (O3). Because ozone strongly absorbs certain wavelengths of ultraviolet radiation, the air begins to warm, helping to perpetuate the upward movement of the air mass as well as helping to create temperature gradients for stratospheric winds. UARS data showed that it takes about 2 years for water vapor anomalies to move from the tropopause (about 17 km) up to the mid-stratosphere (about 30 km). A Canadian instrument launched in 1999 aboard NASA’s Terra satellite uses gas correlation spectroscopy to determine the abundance of methane and carbon monoxide in the troposphere. The Measurements Of Pollution In The Troposphere (MOPITT) sensor measures emitted and reflected radiance from the Earth in three spectral bands. As this light enters the sensor, it passes along two different paths through onboard containers of carbon monoxide and methane. The different paths absorb different amounts of energy, leading to small differences in the resulting signals that directly correlate with the presence of these gases in the atmosphere. Both methane and carbon monoxide are byproducts of burning vegetation as well as fossil fuels. Over the last two decades levels of methane in the atmosphere have risen at an average rate of about 1 percent per year. This is concerning because methane (CH4) is a greenhouse gas about 30 times more efficient than carbon dioxide at trapping heat near the surface. Scientific interest in carbon monoxide (CO) is twofold: the gas controls atmospheric concentrations of oxidants, thus affecting the ability of the atmosphere to clean itself from the ongoing generation of harmful tropospheric ozone from biomass burning and urban smog. Also, through chemical reactions within the lower atmosphere, carbon monoxide contributes to the production of harmful ozone. MOPITT is helping scientists identify the main sources of these gases as well as improve four-dimensional models of their transport through the atmosphere.
ESA’s Envisat will carry the Scanning Imaging Absorption Spectrometer for Atmospheric Cartography (SCIAMACHY), which is an advanced version of the GOME sensor flying aboard ERS-2. In addition to the same four spectral channels contained on GOME (from visible to ultraviolet wavelengths; 240-800 nm), SCIAMACHY has an additional four channels in the near-infrared region of the spectrum (800-2,400 nm). While the sensor’s wide spectral sensitivity makes it useful for cloud and aerosol research, its ability to view both nadir and the Earth’s horizon makes it useful for determining the content and distribution of 16 different trace gases in the atmosphere. |
|
Where Storm Clouds Gather
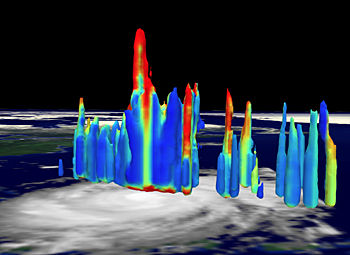
We cannot measure the latent heat contained within clouds. We can, however, measure tropical rainfall. Currently, there is a 50 percent uncertainty in estimates of annual global rainfall. If we are to more accurately determine how much energy our atmosphere receives from latent heat, then we must more accurately measure rainfall. In 1997, NASDA and NASA jointly developed and launched the Tropical Rainfall Measuring Mission (TRMM) into a mid-inclination (35°) precessing orbit. Scientists estimate about 60 percent of our world’s precipitation falls within the band spanning ± 30° north and south of the equator. TRMM carries three instruments designed to measure rainfall—the Precipitation Radar (PR), the TRMM Microwave Imager (TMI), and the Visible and Infrared Scanner (VIRS). Designed and built by NASDA, the Precipitation Radar is the first satellite sensor to provide three-dimensional images of the internal structures of storm clouds. Its measurements show scientists the intensity and distribution of rain within a storm, the total height of a storm, and the elevation at which ice crystals melt into raindrops. Most importantly, the Precipitation Radar can measure rain rates as accurately as 0.7 mm per hour. While scientists expected to use ground-based Doppler Radar stations to validate TRMM’s Precipitation Radar measurements, much to their pleasant surprise they found that the latter exceeds most ground-based measurements in accuracy and spatial resolution.
The TMI is a “passive” sensor designed to measure minute amounts of microwave energy emitted by the Earth’s surface and from within its atmosphere. (Whereas “active” sensors send pulses of energy and then measure how much gets absorbed and reflected by the target, “passive” sensors measure only energy originating from, or reflected by external sources.) These measurements allow TMI to quantify the amount of water vapor, cloud water, and rainfall intensity within the atmosphere. Based upon the design heritage of the Defense Meteorological Satellite Program’s Special Sensor Microwave/Imager (SSM/I), the TMI has a wider viewing swath (780 km) and finer spectral resolution than its predecessors. The TRMM VIRS detects radiant energy in five spectral bands, ranging from visible to infrared wavelengths (from 0.63 to 12 microns). Ideally designed to measure temperature, VIRS can precisely determine cloud top temperatures that scientists can then indirectly correlate with rainfall amounts. |
|
Conclusion
Further Reading King, M. D., Kaufman, Y. J., Tanré, D. and Nakajima, T. (1999) Remote sensing of tropospheric aerosols from space: Past, present, and future. Bulletin of the American Meteorological Society, vol. 80, pp. 2229-2259. Parkinson, C. L. (1997) Earth From Above: Using Color-Coded Satellite Images to Examine the Global Environment. Sausalito: University Science Books. Ramanathan, V., Barkstrom, B. R. and Harrison E. F. (1989) Climate and the Earth’s Radiation Budget. Physics Today, vol. 42, pp. 22-32. |
| Subscribe to the
Earth Observatory About the Earth Observatory Please send comments or questions to: eo-contact@eodomo.gsfc.nasa.gov Responsible NASA Official: David Herring NASA/GSFC Security and Privacy Statement |